

Intravenous High-Dose Ascorbic Acid Reduces the Expression of Inflammatory Markers in Peripheral Mononuclear Cells of Subjects with Metabolic Syndrome
Intravenous high-dose ascorbic acid reduces the expression
of inflammatory markers in peripheral mononuclear cells of
subjects with metabolic syndrome
Authors: Nina Mikirova*# and Ruth C Scimeca#
Riordan Clinic, 3100 North Hillside, Wichita, KS, USA
Abstract
Chronic hyper nutrition is associated with marked oxidative stress and inflammation. Recent studies show that intravenously administered ascorbic acid (IVC), which has been used to treat conditions including fatigue, infection, and cancer, can have an effect on gene expression and epigenetic phenomena. Hence, we analyzed the effect of IVC on mRNA levels of several genes involved in inflammation and stress response. The gene expression modulation in peripheral blood mononuclear cells (PBMCs) from 20 overweight or obese subjects was determined. Participants were infused twice with 15 grams ascorbic acid (AA), with a one-day interval between treatments. The expression profile of several genes related to the inflammation and anti-oxidative enzymes was quantified by real time reverse transcription polymerase chain reaction (qRT-PCR). Total AA and dehydroascorbic acid (DHA) were measured in plasma before and after each treatment. Lipid profile and C reactive protein (CRP) were measured by Bio-Center Laboratory of the Riordan Clinic by standard procedures. We confirmed that, in our subjects expression of mRNA levels of Interleukin 4 (IL-4) and Interleukin 6 (IL-6) correlated with inflammation, as indicated by CRP levels. Moreover, mRNA expression of these genes tended to correlate with body mass index (BMI) and high blood lipid levels. Treatments by IVC resulted in significant increase of blood AA and DHA concentrations. Analysis of mRNA levels on PBMC before and after IVC showed down-regulation of genes coding for Interleukin 8 (IL-8) and up-regulation of Nuclear factor erythroid-derived 2 (NRf2), IL-4, Interleukin 10 (IL-10), Tumor necrosis factor alpha (TNF-α), and Interferon gamma (IFN-γ). IVC treatment yielded regulation of immunological genes in PBMCs, suggesting potential benefits in regulating inflammation and redox potential.
Introduction
Obesity can be accompanied by chronic low grade inflammation,
oxidative stress, and a cluster of symptoms including hypertension,
dyslipidemia, impaired glucose tolerance, and insulin resistance
[1–6]. These symptoms, in turn, are associated with respiratory and
cardiovascular disease, type two diabetes, fatty liver, visceral adiposis,
early aging, cancer, and increased mortality [1,2,7–9]. In an effort
to understand the development of adiposity, the interplay between
inflammation, oxidative stress, and obesity has been studied extensively
[1,2].
The chronic low-grade inflammation that accompanies abdominal
obesity is of particular interest, since expression of inflammation
markers, such as CRP and pro-inflammatory cytokines, correlate with
symptoms such as hypertension and insulin resistance [2,5,8,9-17].
Pro-inflammatory cytokines such TNF-α and IL-6 are overexpressed
in obese subjects, as is nuclear factor kappa-light-chain-enhancer of
activated B cells (NF-κB), the transcription factor that controls many
genes associated with inflammation. Moreover, subjects with adiposity
show reduced serum levels of the anti-inflammatory cytokine IL-10
[11–13]. The production of adipokines also changes in patients with
adiposity. Adipose tissue cells produce both pro-inflammatory (leptin,
plasminogen activation inhibitor 1, TNF-α, angiotensinogen, IL-6 and
anti-inflammatory (adiponectin) cytokines, but the balance tilts toward
production of the pro-inflammatory cytokines in overweight and obese
subjects [2].
Changes in cellular gene expression have also been detected in
overweight and obese patients. In obese individuals, adipose tissue
cells and PBMCs exhibit an increase in gene expression of proinflammatory cytokines [2,10–12,14–16,18]. In addition, mononuclear
cells in these subjects are characterized by increased expression and
activities of transcription factors NF-κB, as well as decreased levels
of the inhibitor of kappa light polypeptide gene enhancer in B cells,
kinase beta (IKKB-B) [11,14]. Diet induced weight loss in patients with
adiposity has been shown to correct gene expression abnormalities
related to pro-inflammatory cytokine production and to reduce NF-κB
activation in PBMCs.
The inflammation observed in obese subjects may be triggered
by oxidative stress [19,20]. Excess consumption of glucose and fatty
acids leads to tricarboxylic acid (TCA) cycle overload and increased
Acetyl-CoA production [2]. Excess Acetyl-CoA stimulates production
of reactive oxygen species (ROS) from the electron transport chain
reactions in mitochondria, leading to hydrogen peroxide buildup
[2]. This oxidative stress induces changes in the expression of genes
associated with cancer progression [21,22]. Oxidation may also
influence the length of telomeres, nucleotide sequences at the end
of chromosomes that play a role in cancer and are inversely related to insulin resistance [22,23]. Finally, oxidative stress modulates
transcription factors, including NF-κB and activation protein one
(AP-1), involved in differentiation, proliferation, and apoptosis [18].
In contrast, diets high in antioxidant rich foods such as olive oil, fruits,
and vegetables have been shown to lower mRNA levels of inflammatory
cytokines in PBMCs [24,25].
Vitamin C (AA) is a water soluble antioxidant that may also
modulate gene expression [26-28]. When AA is infused intravenously
at doses of 10 grams or higher, it can reach millimolar concentrations
in the blood. At these concentrations, it shows cytotoxicity against
some types of cancer cells [29-31] and inhibits the expression of NFκB genes [32-33]. It also suppresses specificity protein transcription
factors (Sp1, 2, 3, and 4) and modulates tumor protein 53 (p53) [34,35].
Several studies have also shown the positive effects of high dose IVC in
cancer patients as an adjunct therapy or by itself [36,37].
The experiments in the present manuscript are designed to determine
if, and how, IVC might affect the mRNA expression levels of PBMCs
in overweight and obese subjects. We have chosen to analyze mRNA
levels on PBMC since they play key roles in the inflammatory process
and are easy to obtain [14,18]. PBMCs have been shown increased
expression of pro-inflammatory cytokine production in obese subjects
[18], correlating with visceral fat amounts and inflammation in these
subjects [14–16,38,39]. Also, PBMCs from overweight individuals have
shown increased secretion of pro-inflammatory cytokines, including
TNF-α, IFN-γ, and interleukin two (IL-2), along with decreased
secretion of the anti-inflammatory cytokine IL-10 [24,40]. Therefore,
we measured gene expression of several cytokines and other proteins in
PBMC from overweight subjects before and after treatments with IVC.
Materials and methods
Recruitment of subjects
Twenty subjects (15 women and 5 men, ages 30 to 71) were
recruited for a short-term (one week) study, in order to assess the effect
of IVC on gene expression in PBMCs. Subjects were recruited among
the employees of the Riordan Clinic and provided written informed
consent to participate in the study. The research was in compliance of
the declaration of Helsinki and approved by the Institutional Review
Board of Riordan Clinic.
All participants were in good health as determined by a medical
history and clinical laboratory tests. Subjects fulfilled the following
criteria:
1) No history of chronic disease
2) No antibiotic or supplemental vitamin C use for two weeks
before the beginning of the study
3) Nonsmoking
4) No drugs or nonsteroidal inflammatory drugs two weeks
before and during the study.
Subjects with type 1 diabetes mellitus, autoimmune diseases,
malignant diseases, and infectious diseases were excluded from the
study. Participants maintained their usual habits including physical,
sleeping habits and diet during the study. All subjects were overweight
as defined by a body mass index (BMI) above 25.
After enrollment, participants received two 15 g IVC treatments,
with a one day interval between treatments, following the procedure
outlined in the Riordan IVC protocol (www.riordanclinic.org/
protocol). Blood samples were drawn immediately before and after
each IVC treatment.
Isolation of PBMC
Whole blood was collected by venipuncture into heparinized
tubes. For PBMC collection, blood was diluted 1:1 with phosphate
buffered saline (PBS), layered on top of Ficoll-Paque Plus (Amersham
Biosciences), and centrifuged at 400 g for 30 minutes at 4°C. PBMC
were then removed from the plasma-Ficoll interface by pipette and
rinsed twice with PBS.
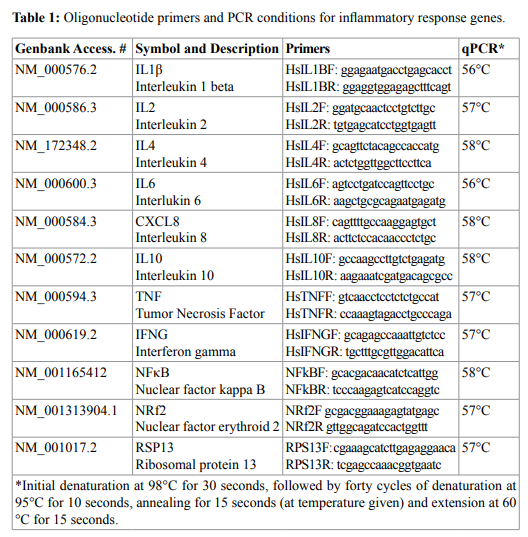
RNA extraction and qRT-PCR
PBMCs were removed from PBS and 1ml of TriReagent (SigmaAldrich, Hercules CA) was added for RNA extraction following
manufacturer’s instructions. Total RNA quality and quantity was
evaluated using the Nanodrop ND-2000 (Thermo Scientific, Pittsburg
PA) and subsequently converted to cDNA using the iScript RT
supermix in the CFX96 Real-Time PCR Detection System (Bio-Rad,
Hercules, CA, USA). cDNA was than quantified using the Nanodrop
ND-2000 and a total of 250 ng were used to analyze gene-specific
oligonucleotide primers (Table 1) with the SsoAdv Universal SYBR
GREEN Kit. A dissociation curve was run at the end of the reaction
to ensure that only one amplicon was formed and that the amplicons
denatured consistently in the same temperature range for every
sample. The cDNA levels were normalized against housekeeping gene
Ribosomal protein 13 (RPS13).
Plasma ascorbic acid and dehydroascorbic acid levels
Initial levels of reduced and oxidized AA were measured in the
morning between two and three hours after breakfast for each subject.
A two mL aliquot of heparinized whole blood was centrifuged at 1000
g for 10 minutes and plasma was harvested. Plasma was then diluted
1:5 with methanol/water for AA and DHA determinations. The AA
and DHA assays were conducted as described previously [41-42]
using a commercially available kit (“Ascorbic Assay Kit”, Cayman Chemical Co.). Briefly, ascorbic acid is oxidized to dehydroascorbic
acid, which then reacts with o-phenylenediamine (ophenylenediamine
dihydrochloride (OPDA), Sigma Aldrich) to form the condensation
product. This allows to measure total ascorbate (AA+DHA). Addition
of buffer instead of oxidizing reagent (Tempol; CAS No: 2226-96-2,
Sigma-Aldrich) results in the measurements of DHA. Concentrations
of AA were calculated by subtraction of DHA from total ascorbate.
The fluorescence emission of the resulting product was measured by
Fluorolog -3 by fluorescence at excitation 340-350 nm and emission
420-430 nm.
Clinical parameters
Lipid profile and CRP in blood serum (collected by venipuncture
and centrifugation) were measured by Bio-Center Laboratory of the
Riordan Clinic by standard procedure.
Statistical analysis
The analysis and comparisons of mRNA expression levels were
carried out using the Kaleidagraph (Synergy Software, Reading PA,
USA) and Systat Software ( San Jose, CA, USA) statistical software.
Data are presented as mean ± SD. Pre and post treatment comparison
was performed using paired t-tests and ANOVA. Differences in mean
values were considered significant at the level of 95% (p<0.05). Outliers
in gene expression data were removed based on the interquartile
range test. The 2−ΔΔCt method was used to calculate differences in gene
expression.
Results
Initial Parameters
Basic characteristics of the subjects at the beginning of the study
are presented in the Table 2. No adverse effects were observed after
IVC infusions. Based on comparison of mean values to normal
ranges, subjects in general were obese (three quarters of the subjects
had mean BMI values above 30) with elevated cholesterol levels and
abnormally high lipid-to-HDL ratios. This occurs because while HDL
levels tend to fall within the normal range, the levels of other lipids
(cholesterol, triglycerides, VLDL, and LDL) tend toward higher levels,
with significant percentages of patients showing above-normal values.
Blood pressure levels were, on average, normal, but the mean CRP level
for these subjects was substantially above normal, with seventy percent
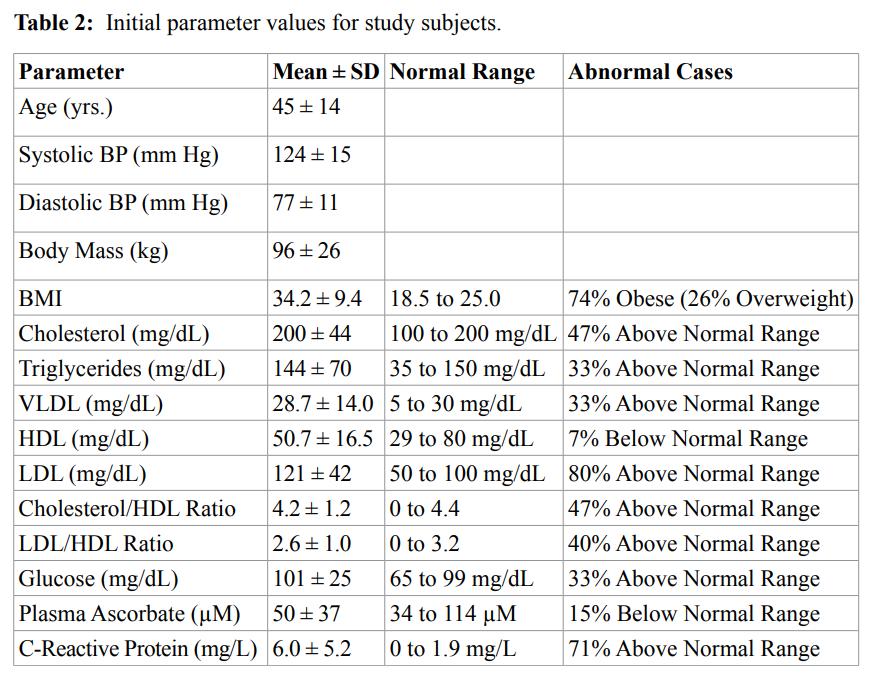
of the subjects having CRP levels outside the normal range, suggesting
that inflammation was an issue in many of the subjects.
Plasma ascorbate and dehydroascorbate
Prior to intravenous ascorbate treatments, the average plasma
ascorbic acid concentration was 50 ± 37 µM, and most values fell within
the normal range (Table 2). Intravenous infusions increased these AA
levels by roughly two orders of magnitude, with mean value one hour
post infusion reaching 6.4 ± 3.1 mM (or 6400 ± 3100 µM). We observed
a linear relationship between the post-IVC plasma AA concentrations
and the dose given, normalized to body mass (r=0.60, p<0.01; data
not shown). The mean dehydroascorbic acid concentration in plasma
before treatment was 55 ± 30 µM, and the initial mean AA:DHA ratio
was 1.1 ± 0.8.
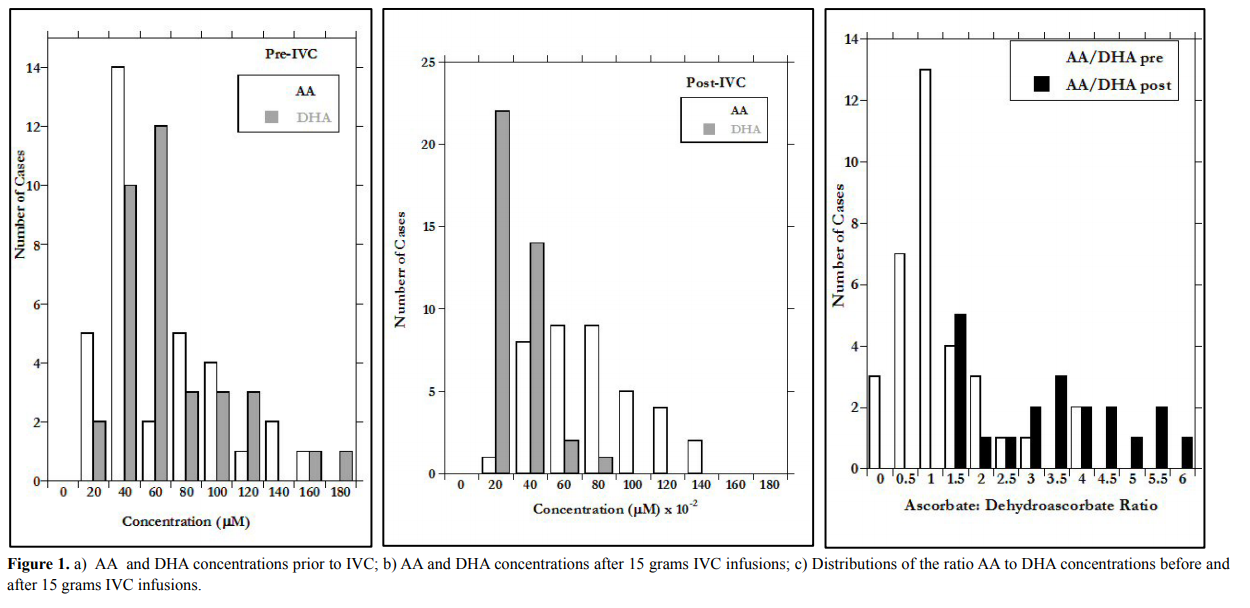
After IVC, the mean DHA concentration increased to 2.0 ± 1.6
mM and the AA:DHA ratios increased dramatically. This is shown in
Figures 1(a-c), where distributions of AA, DHA, and AA:DHA before
and after IVC infusion are shown.
The difference in X-axis scale between Figures 1a (before IVC)
and 1b (after IVC) show the two order of magnitude increase due to
infusion. According to our data, the infusion increase in AA is more
than three times as great as that of DHA, but is also more variable,
leading to the wide range in AA:DHA values observed post infusion
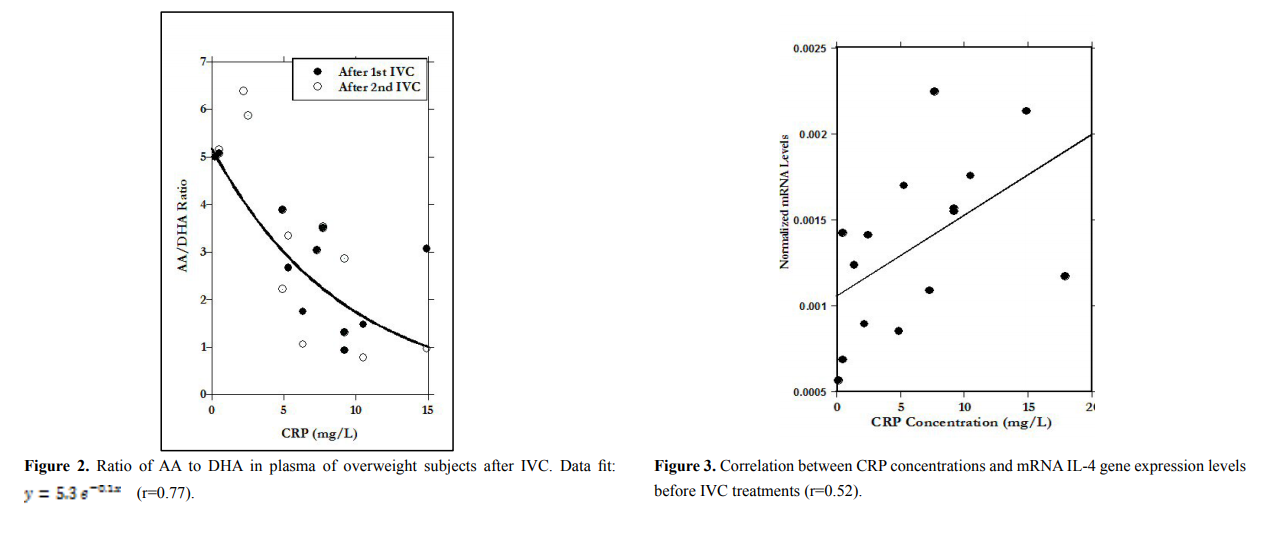
(Figure 1c). The AA:DHA ratios, in fact, show a strong (r=0.77) inverse
correlation with CRP concentration. Since CRP is an inflammation
marker, and inflammation is thought to be accompanied by oxidative
stress, the data in Figure 2 are consistent with the idea that redox
conditions accompanying inflammation may increase the rate of AA
oxidation to DHA.
mRNA gene expression levels before IVC infusions
We examined potential correlations between mRNA levels in
PBMC and CRP, BMI, and various lipid profile parameters. Based on
linear regression, mRNA expression of IL-6 and IL-4 increase with
increasing CRP levels (linear regression, r=0.55, p<0.02 and r=0.52,
p<0.02 respectively) while mRNA levels of IFN-γ slightly decreased
with increasing CRP levels (r=0.26, p<0.17). The results for IL-4 are
illustrated in Figure 3. This suggests that mRNA expression levels of
some inflammatory cytokines were higher in patients who showed
higher levels of inflammation via CRP concentration.
To examine the relationship between PBMC mRNA levels and
BMI, we divided subjects into quartiles based on BMI:
Q1: below 28.0;
Q2: 28.0 to 39.7;
Q3: 39.7 to 41.6;
Q4: above 41.6.
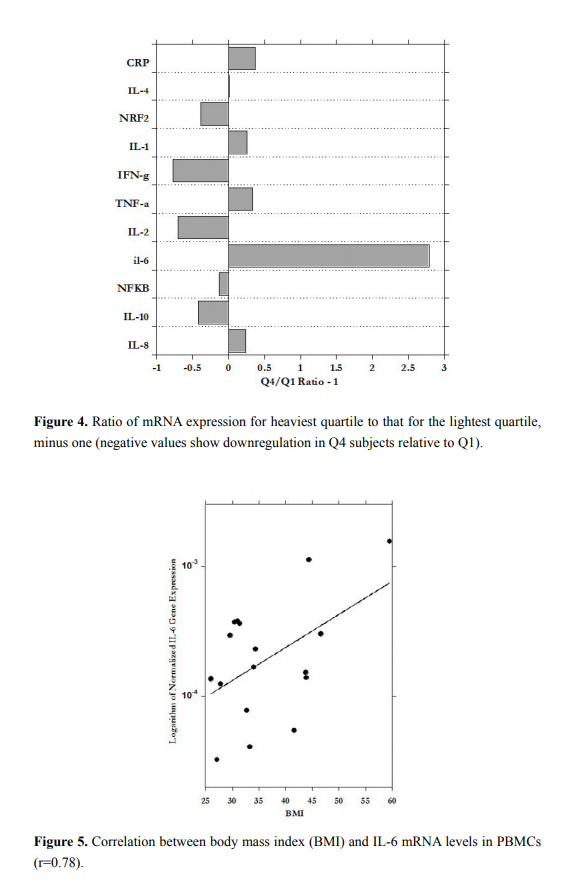
Figure 4 shows the ratio of mRNA levels for subjects in the fourth
quartile (Q4) to those in the first quartile (Q1). According to our data,
the increases in BMI are associated with a three-fold increase in the
expression of IL-6, along with less dramatic increases in TNF-α, IL-1,
IL-8, and CRP. Meanwhile, IL-10, IL-2, and IFN-γ were downregulated
in the heaviest subjects relative to the least heavy.
Figure 5, shows the significant correlation between PBMC IL-6
expression and BMI. In general, mRNA expression in PBMC showed
a trend with increased BMI: direct association between BMI and
pro-inflammatory markers IL-8, IL-6, IFN-γ and inverse association
with IL-10, IL-2, but for most of markers the correlations were not
statistically significant.
In addition, we examined potential correlations between
PBMC mRNA levels of selected genes and lipid profile parameters.
Correlations were analyzed between the target gene expressions and
cholesterol, triglycerides, VLDL, HDL cholesterol, LDL, cholesterol
to HDL ratio and LDL to HDL ratios. TNF-α expression correlated
directly with triglycerides (r=0.4, p<0.1), VLDL (r=0.4, p<0.1) and
cholesterol/HDL ratio (r=0.41, p<0.09), while correlating inversely
with HDL (R=-0.44, p<0.07). Other correlations we found included:
IL-8 and cholesterol (R=0.4, p<0.1), IL-10 and VLDL (R=-0.37, p<0.14),
IL-6 and cholesterol (R=0.69, p<0.01), IL-6 and LDL (r=0.6, p<0.01);
IL-4 and cholesterol/HDL (R=0.45, p<0.06), and IL-4 and LDL/HDL
ratio (R=0.43, p<0.08). These results confirm the idea that conditions
associated with adiposity, such as dyslipemia, are accompanied by
changes in PBMC gene expression favoring inflammation.
Effect of IVC on PBMC gene expression
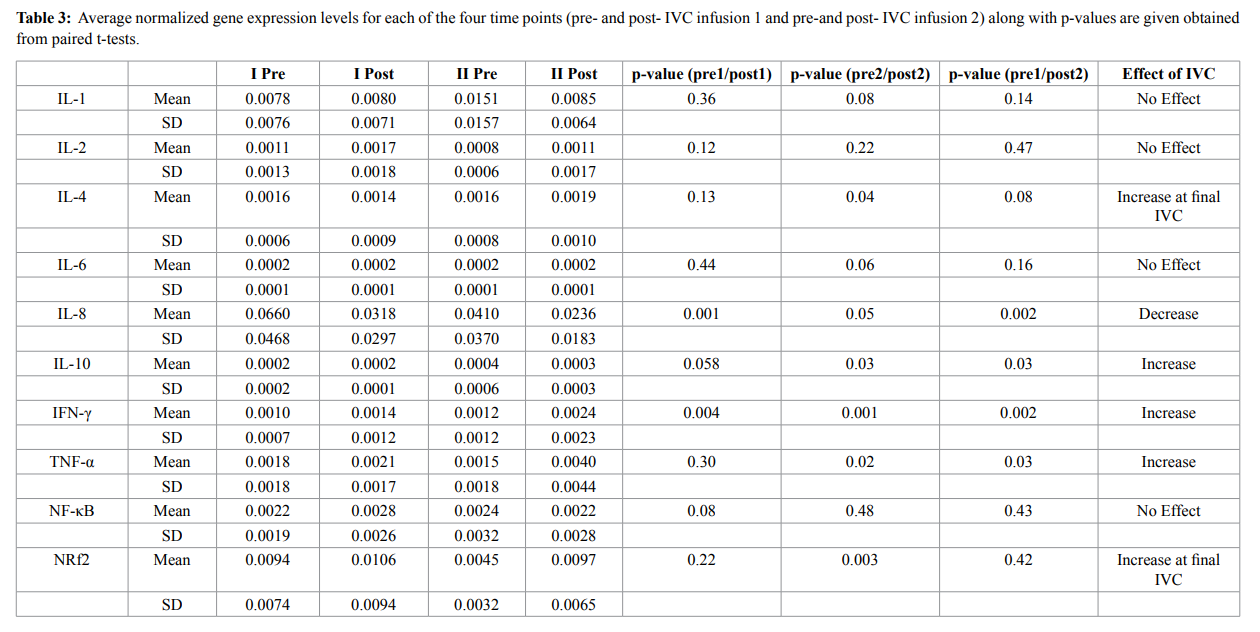
Table 3 shows PBMC mRNA expression levels of various cytokines
during the time course of the study. In general, IL-1, IL-2, IL-6 and NFκB showed no discernable, statistically significant, systematic changes
during the time frame of the study. For the cytokines IL-4, IL-10, NRf2
and TNF-α gene expression levels remained constant during the first
IVC, but then rose after the second IVC infusion (Table 3).
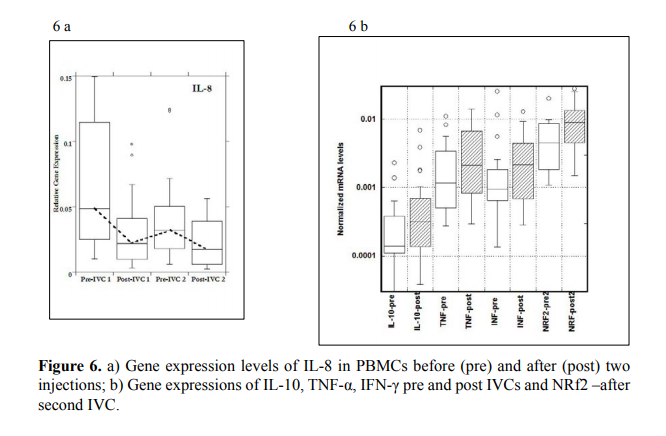
The most dramatic and statistically significant changes during the
study occurred with IL-8 and IFN-γ expressions. Data for all changed
genes are shown in Figure 6A and 6B.
For IL-8, a pro-inflammatory cytokine, gene expression in PBMCs
decreased during the time course of the study, with values before
IVC infusions (Pre) being significantly higher than those after IVC
infusions (Post). This is especially interesting since IL-8 is up-regulated
by oxidative stress; adding the antioxidant ascorbate may reduce
IL-8 mRNA levels by reducing oxidative stress. In the case of NRf2,
a molecule associated with cellular response to oxidative stress, and
one that is below normal in obese subjects in general, gene expression
after second IVC infusion was significantly higher than that seen
before IVC. This is also a potentially positive development, as NRf2
signaling is involved in the upregulation of enzymes that mediate the
detoxification of reactive metabolites and ROS.
Discussion
The subjects in this study tended toward obesity, and showed typical
symptoms of adiposity, including elevated cholesterol and lipid levels
(other than HDL), high blood glucose concentrations, and abnormally
high levels of the inflammation marker CRP. Conditions associated
with adiposity, in turn were accompanied by changes in PBMC gene
expression favoring inflammation. For example, mRNA levels of
IL-6 and IL-4 correlated with BMI and with CRP concentration, as
did TNF-α, IL-1, IL-8, to a lesser degree. Moreover, mRNA levels of
TNF-γ and IL-8 correlated with cholesterol levels in these subjects.
This is consistent with observations in the literature that inflammatory
cytokine levels correlate with obesity [17]. High CRP levels also
correlated with reduced AA:DHA ratios, consistent with reports in the
literature associating inflammation in obese subjects with oxidative
stress.
The investigation of the association mRNA levels of proinflammatory and anti-inflammatory markers in PBMCs before
treatment with BMI sorted by quartiles (Q3 vs. Q1) demonstrated
upregulated mRNA levels of IL-6 (ratio 3.8), IL-1, IL-8, TNF-α and
serum CRP and reduced mRNA levels of IL-10, IL-2, INF-γ and NRf2.
Since IVC is used extensively in our clinic, and, as it was shown
in our studies, high dose intravenous ascorbic acid can act to reduce
inflammation [44-45], we were interested in learning how IVC
might affect inflammation in subjects with adiposity. The treatments
of participants by IVC resulted in significant increase of AA, DHA
concentrations and ratio AA to DHA in blood. This ratio was decreased
with increased levels of inflammation in participants, which may
be explained by increased level of oxidative stress in subjects with
metabolic syndrome.
Our study was too short-term to examine how vitamin C might
benefit health overall for these subjects and more females than males
were included, but we did learn that the infusions can have some
effect on PBMC gene expression. For instance, mRNA levels of the
inflammatory cytokine IL-8 were reduced significantly during the
study, while expression of NRf2, which plays a role in counteracting
oxidative stress, was increased. On the other hand, mRNA levels
of TNF-α, IL-4 and IL-10 remained constant until the second IVC
infusion, at which point they increased. TNF-α has distinct effects
on adipose tissue, including stimulation of lipolysis, suppression of
lipogenesis, induction of adipocyte dedifferentiation, and impairment
of pre-adipocyte differentiation in vitro. TNF-α may also induce
apoptosis in human adipose cells [43]. Thus, the increase in TNF-α
expression may be beneficial in modifying adipose tissue mass.
We did not see an effect of IVC infusion on mRNA levels of NFκB. This is somewhat surprising since multiple treatments with IVC
have been shown to reduce levels of inflammatory cytokines in patients
with cancer and rheumatoid arthritis [44-45]. These studies measured
concentration, rather than gene expression, and used treatments
carried out of over a longer duration.
mRNA levels of the pro-inflammatory cytokines (IL-1, IL-6) were
not significantly affected by IVC, but this may simply be a case of
not having enough replicate data points, or may be due to the short
duration of the study (two infusion, one week). The treatment caused
upregulation of anti-inflammatory markers such as IL-10 and IL-4. We
also found up-regulation of mRNA expression of INF-γ as the result of
the treatments (p<0.002).
The possibility that IVC increases mRNA levels of NRf2 (there was
not a change from the beginning of the study to the end of the first
injection, but levels post-IVC infusion were significantly higher than
levels immediately prior to infusion for the second IVC) is of interest
due to the link between inflammation and oxidative stress. Aerobic
organisms are thought to have acquired this gene through evolution in
order to protect them against ROS damage [46-49]. NRf2 expression
is induced by oxidative stress, and is central to efficient detoxification
of reactive metabolites and ROS [50,51]. Over two-hundred gene
products are thought to be under the transcriptional control of NRf2,
including enzymes responsible for the production of antioxidants and
reducing equivalents [47,52]. The main classes of NRF2-regulated
genes include anti-oxidative enzymes like NAD(P)H:Quinone
oxidoreductase (NQO1), epoxide hydrolase, aldehyde dehydrogenase,
aldo-keto reductase, catalase, heme oxygenase 1 (HO-1), and enzymes
involved in glutathione homeostasis, including glutathione reductases,
peroxiredoxin, thioredoxin and thioredoxin reductases and glutathione
peroxidase [50,53]. Moreover, NRf2 activation leads to an increased
cellular energetics and redox potential [52,53]. Declines in NRf2
levels with ageing promotes oxidative damage, and age related NRf2
inhibition is observed in Parkinson’s, Alzheimer’s, and Huntington’s
diseases as well as atherosclerosis [49-56].
The activation of NRf2 by high dose vitamin C treatment can
induce the protection against age-related degenerative diseases and
cancer. Further studies of the effects of high does vitamin C on NRf2
gene expression would offer the potential to develop treatment to
promote longevity, healthy ageing and lower cancer incidence. In summary, our pilot study demonstrated that high dose vitamin
C (IVC 15g) has potential effects in alleviating inflammatory status
and improving defense status of PBMCs in subjects with metabolic
syndrome.
The limitations of the study are the small size of the analyzed
population; participants were not separated by sex and the higher
number of females than males included in our research study. Further
research in this area and clinical studies of the efficacy of intravenous
high dose vitamin C in the treatment of patients with metabolic
syndrome are warranted.
References
1. Bonomini F, Rodella LF, Rezzani R (2015) Metabolic syndrome, aging and involvement
of oxidative stress. Aging Dis 6: 109-120. [Crossref]
2. Muñoz A, Costa M (2013) Nutritionally mediated oxidative stress and inflammation.
Oxid Med Cell Longev 2013: 610950. [Crossref]
3. Montero D, Walther G, Stehouwer CD, Houben AJ, Beckman JA, et al. (2014) Effect
of antioxidant vitamin supplementation on endothelial function in type 2 diabetes
mellitus: a systematic review and meta-analysis of randomized controlled trials. Obes
Rev 15: 107-116. [Crossref]
4. Medzhitov R (2008) Origin and physiological roles of inflammation. Nature 454: 428-
435. [Crossref]
5. Hajer GR, van Haeften TW, Visseren FL (2008) Adipose tissue dysfunction in obesity,
diabetes, and vascular diseases. Eur Heart J 29: 2959-2971. [Crossref]
6. Zulet MA, Puchau B, Navarro C, Martí A, Martínez JA (2007) [Inflammatory
biomarkers: the link between obesity and associated pathologies]. Nutr Hosp 22: 511-
527. [Crossref]
7. Boura-Halfon S, Zick Y (2009) Phosphorylation of IRS proteins, insulin action, and
insulin resistance. Am J Physiol Endocrinol Metab 296: E581-591. [Crossref]
8. Hotamisligil GS, Shargill NS, Spiegelman BM (1993) Adipose expression of tumor
necrosis factor-alpha: direct role in obesity-linked insulin resistance. Science 259: 87-
91. [Crossref]
9. Van Gaal LF, Mertens IL, De Block CE (2006) Mechanisms linking obesity with
cardiovascular disease. Nature 444: 875-880. [Crossref]
10. Bastard JP, Jardel C, Bruckert E, Blondy P, Capeau J, et al. (2000) Elevated levels ofinterleukin 6 are reduced in serum and subcutaneous adipose tissue of obese women
after weight loss. J Clin Endocrinol Metab 85: 3338-3342. [Crossref]
11. Satoh-Asahara N, Shimatsu A, Sasaki Y, Nakaoka H, Himeno A, et al. (2012) Highly
purified eicosapentaenoic acid increases interleukin-10 levels of peripheral blood
monocytes in obese patients with dyslipidemia. Diabetes Care 35: 2631-2639.
[Crossref]
12. Esposito K, Pontillo A, Giugliano F, Giugliano G, Marfella R, et al. (2003) Association
of low interleukin-10 levels with the metabolic syndrome in obese women. J Clin
Endocrinol Metab 88: 1055-1058. [Crossref]
13. Carvalho GQ, Pereira PF, Serrano HM, do Carmo Castro Franceschini S, Oliveira de
Paula S, et al. (2010) Peripheral expression of inflammatory markers in overweight
female adolescents and eutrophic female adolescents with a high percentage of body
fat. Appl Physiol Nutr Metab 35: 464-470. [Crossref]
14. Ghanim H, Aljada A, Hofmeyer D, Syed T, Mohanty P, et al. (2004) Circulating
mononuclear cells in the obese are in a proinflammatory state. Circulation 110: 1564-
1571. [Crossref]
15. Catalan V, Catala V, Gomez-Ambrosi J, Rodriguez A, Ramirez B, et al. (2015).
Peripheral mononuclear blood cells contribute to the obesity associated inflammatory
state independently of glycemic status: involvement of the novel pro-inflammatory
adipokines chemerin, chitinase-3-like protein , lipocalin-2 and osteopontin. Genes Nutr
10: 11. [Crossref]
16. Weisberg SP, McCann D, Desai M, Rosenbaum M, Leibel RL, et al. (2003) Obesity is
associated with macrophage accumulation in adipose tissue. J Clin Invest 112: 1796-
1808. [Crossref]
17. Lucas R, Parikh SJ, Sridhar S, Guo DH, Bhagatwala J, et al. (2013) Cytokine profiling
of young overweight and obese female African American adults with prediabetes.
Cytokine 64: 310-315. [Crossref]
18. Ghanim H, Aljada A, Hofmeyer D, Syed T, Mohanty P, et al. (2004) Circulating
mononuclear cells in the obese are in a proinflammatory state. Circulation 110: 1564-
1571. [Crossref]
19. Ceriello A, Motz E (2004) Is oxidative stress the pathogenic mechanism underlying
insulin resistance, diabetes, and cardiovascular disease? The common soil hypothesis
revisited. Arterio Thromb Vascular Bio 24: 816–823. [Crossref]
20. Wright E Jr, Scism-Bacon JL, Glass LC (2006) Oxidative stress in type 2 diabetes: the
role of fasting and postprandial glycaemia. Int J Clin Pract 60: 308-314. [Crossref]
21. Chervona Y, Costa M (2012) Histone modifications and cancer: biomarkers of
prognosis? Am J Cancer Res 2: 589-597. [Crossref]
22. Kurdistani SK (2011) Histone modifications in cancer biology and prognosis. Prog
Drug Res 67: 91-106. [Crossref]
23. Demissie S, Levy D, Benjamin EJ, Cupples LA, Gardner JP, et al. (2006) Insulin
resistance, oxidative stress, hypertension, and leukocyte telomere length in men from
the Framingham Heart Study. Aging Cell 5: 325-330. [Crossref]
24. de Mello VD, Kolehmainen M, Schwab U, Mager U, Laaksonen DE, et al. (2008)
Effect of weight loss on cytokine messenger RNA expression in peripheral blood
mononuclear cells of obese subjects with the metabolic syndrome. Metabolism 57:
192-199. [Crossref]
25. de Mello VD, Kolehmanien M, Schwab U, Pulkkinen L, Uusitupa M (2012) Gene
expression of peripheral blood mononuclear cells as a tool in dietary intervention
studies: What do we know so far? Mol Nutr Food Res 56: 1160-1172. [Crossref]
26. Chojkier M, Houglum K, Solis-Herruzo J, Brenner DA (1989) Stimulation of collagen
gene expression by ascorbic acid in cultured human fibroblasts. A role for lipid
peroxidation? J Biol Chem 264: 16957-16962. [Crossref]
27. Lyons BL, Schwarz RI (1984) Ascorbate stimulation of PAT cells causes an increase in
transcription rates and a decrease in degradation rates of procollagen mRNA. Nucleic
Acids Res 12: 2569-2579. [Crossref]
28. Murad S, Grove D, Lindberg KA, Reynolds G, Sivarajah A, et al. (1981) Regulation of
collagen synthesis by ascorbic acid. Proc Natl Acad Sci U S A 78: 2879-2882. [Crossref]
29. Levy TE (2012). Primal Panacea. MedFox Publishing.
30. Harakeh S, Diab-Assaf M, Khalife JC, Abu-el-Ardat KA, Baydoun E, et al. (2007)
Ascorbic acid induces apoptosis in adult T-cell leukemia. Anticancer Res 27: 289-298.
[Crossref]
31. Mastrangelo D, Massai L, Lo Coco F, Noguera NI, et al. (2015) Cytotoxic effects of
high concentrations of sodium ascorbate on human myeloid cell lines. Ann Hematol
94: 1807-1816. [Crossref]
32. Cárcamo JM, Pedraza A, Bórquez-Ojeda O, Zhang B, Sanchez R, et al. (2004) Vitamin
C is a kinase inhibitor: dehydroascorbic acid inhibits IkappaBalpha kinase beta. Mol
Cell Biol 24: 6645-6652. [Crossref]
33. Bowie AG, O’Neill LA (2000) Vitamin C inhibits NF-kappa B activation by TNF via
the activation of p38 mitogen-activated protein kinase. J Immunol 165: 7180-7188.
[Crossref]
34. Pathi SS, Lei P, Sreevalsan S, Chadalapaka G, Jutooru I, et al. (2011) Pharmacologic
doses of ascorbic acid repress specificity protein (Sp) transcription factors and Spregulated genes in colon cancer cells. Nutr Cancer 63: 1133-1142. [Crossref]
35. Kim JE, Jin DH, Lee SD, Hong SW, Shin JS, et al. (2008) Vitamin C inhibits p53-
induced replicative senescence through suppression of ROS production and p38 MAPK
activity. Int J Mol Med 22: 651-655. [Crossref]
36. Raymond YC, Glenda CS, Meng LK (2015) Effects of High Doses of Vitamin C on
Cancer Patients in Singapore: Nine Cases. Integr Cancer Ther. [Crossref]
37. Hoffer LJ, Robitaille L, Zakarian R, Melnychuk D4, Kavan P5, et al. (2015) Highdose intravenous vitamin C combined with cytotoxic chemotherapy in patients with
advanced cancer: a phase I-II clinical trial. PLoS One 10: e0120228. [Crossref]
38. Yamaoka M, Maeda N, Nakamura S, Kashine S, Nakagawa Y, et al. (2012) A pilot
investigation of visceral fat adiposity and gene expression profile in peripheral blood
cells. PLoS One 7: e47377. [Crossref]
39. Yamaoka M, Maeda N, Nakamura S, Mori T, Inoue K, et al. (2013) Gene expression
levels of S100 protein family in blood cells are associated with insulin resistance and
inflammation (Peripheral blood S100 mRNAs and metabolic syndrome). Biochem
Biophys Res Commun 433: 450-455. [Crossref]
40. Dicker D, Salook MA, Marcoviciu D, Djaldetti M, Bessler H (2013) Role of peripheral
blood mononuclear cells in the predisposition of obese individuals to inflammation and
infection. Obes Facts 6: 146-151. [Crossref]
41. Koshiishi I, Imanari T (1997) Measurement of ascorbate and dehydroascorbate contents
in biological fluids. Anal Chem 69: 216-220. [Crossref]
42. Bakaev VV, Efremov AV, Tityaev II (1999) Low levels of dehydroascorbic acid
in uraemic serum and the partial correction of dehydroascorbic acid deficiency by
haemodialysis. Nephrol Dial Transplant 14: 1472-1474. [Crossref]
43. Prins JB, Niesler CU, Winterford CM, Bright NA, Siddle K, et al. (1997) Tumor
necrosis factor-alpha induces apoptosis of human adipose cells. Diabetes 46: 1939-
1944. [Crossref]
44. Mikirova N, Riordan N, Casciari J (2016) Modulation of Cytokines in Cancer Patients
by Intravenous Ascorbate Therapy. Med Sci Monit 22: 14-25. [Crossref]
45. Mikirova N, Casciari J, Rogers A, Taylor P (2012) Effect of high-dose intravenous
vitamin C on inflammation in cancer patients. J Transl Med 10: 189. [Crossref]
46. Kensler TW, Wakabayashi N, Biswal S (2007) Cell survival responses to environmental
stresses via the Keap1-Nrf2-ARE pathway. Annu Rev Pharmacol Toxicol 47: 89-116.
[Crossref]
47. Hoeijmakers JH (2009) DNA damage, aging, and cancer. N Engl J Med 361: 1475-
1485. [Crossref]
48. Harper JW, Elledge SJ (2007) The DNA damage response: ten years after. Mol Cell 28:
739-745. [Crossref]
49. Martín-Montalvo A, Villalba JM, Navas P, de Cabo R (2011) NRF, cancer and calorie
restriction. Oncogene 30: 505-520. [Crossref]
50. Ingram DK, Cutler RG, Weindruch R, Renquist DM, Knapka JJ, et al. (1990) Dietary
restriction and aging: the initiation of a primate study. J Gerontol 45: B148-163.
[Crossref]
51. Kwak MK, Wakabayashi N, Greenlaw JL, Yamamoto M, Kensler TW (2003)
Antioxidants enhance mammalian proteasome expression through the Keap1-Nrf2
signaling pathway. Mol Cell Biol 23: 8786-8794. [Crossref]
52. Leonard MO, Kieran NE, Howell K, Burne MJ, Varadarajan R, et al. (2006)
Reoxygenation-specific activation of the antioxidant transcription factor Nrf2 mediates
cytoprotective gene expression in ischemia-reperfusion injury. FASEB J 20: 2624-2626.
[Crossref]
53. Lee JM, Shih AY, Murphy TH, Johnson JA (2003) NF-E2-related factor-2
mediates neuroprotection against mitochondrial complex I inhibitors and increased
concentrations of intracellular calcium in primary cortical neurons. J Biol Chem 278:
37948-37956. [Crossref]
54. Kraft AD, Johnson DA, Johnson JA (2004) Nuclear factor E2-related factor 2-dependent antioxidant response element activation by tert-butylhydroquinone and sulforaphane
occurring preferentially in astrocytes conditions neurons against oxidative insult. J
Neurosci 24: 1101-1112. [Crossref]
55. Suh JH, Shenvi SV, Dixon BM, Liu H, Jaiswal AK, et al. (2004) Decline in
transcriptional activity of Nrf2 causes age-related loss of glutathione synthesis, which
is reversible with lipoic acid. Proc Natl Acad Sci U S A 101: 3381-3386. [Crossref]
56. Praticò D, Delanty N (2000) Oxidative injury in diseases of the central nervous system:
focus on Alzheimer’s disease. Am J Med 109: 577-585. [Crossref]