


Bioenergetics of Human Cancer Cells and Normal Cells During Proliferation and Differentiation
Nina A. Mikirova¹, Joseph J. Casciari¹, *Michael J. Gonzalez², Jorge R. Miranda-Massari³, Neil H. Riordan¹ and Jorge Duconge³
1 Riordan Clinic, 3100 Hillside Ave, Wichita, Kansas 67219, University of Puerto Rico, Medical Sciences Campus, RECNAC
2 Schools of Public Health, San Juan P.R
3 School of Pharmacy, GPO Box 365067San Juan PR 00936-5067
Submission: February 24, 2017; Published: March 22, 2017
*Correspondence Address: Dr. Michael J Gonzalez, University of Puerto Rico, Medical Sciences Campus, School of Public Health, Department of Human Development, Nutrition Program, GPO Box 365067, San Juan P.R 00936-5067, Tel: x 1405; 787-649-2737.
Abstract
Cancer cells are known to have different metabolic properties than normal cells, particularly their tendency to undergo glycolysis even under aerobic favoring conditions. This has created interest in how mitochondrial function in tumor cells may differ from that in normal cells. Using human malignant cells (SW-620, PC-3, HT-1080, SK-MEL, HL-60, K-562 and MOLT-3), human fibroblast (CCL-153) and human T Cells, we investigated three key parameters that have been typically to describe mitochondrial function: cellular ATP production, mitochondrial potential and cellular cardiolipin levels. On average, tumor cancer cells had more ATP production and greater mitochondrial potentials. For example, ATP levels in malignant cells ranged from 20 to 69 µmole/106 cells, with a cancer cell average of 40 ± 18 µmole/106 cells. For normal cells, the ATP level range went from 9 to 24 µmole/106 cells, for an average of 15 ± 11 µmole/106 cells. Mitochondrial potentials tended to be three times higher in cancer cells, perhaps because overall mitochondrial mass (as measured by relative cardiolipin levels) were twice as high in cancer cells. Higher mitochondrial masses are consistent with proliferation. Proliferating cells in general showed higher mitochondrial function compared to quiescent cells (confluent monolayers), and HL-60 cells showed reductions in all three mitochondrial parameters measured here when the cells were exposed to the differentiating agent TPA. The effects of ATP production inhibitors CCCP and oligomycin on mitochondrial function in normal and cancer cells were also compared. In general, in these experiments, cancer cell mitochondrial inhibition with these agents produced a decrease ATP levels by 30-40% while in normal cells ATP production was reduced by 60%. These results provideevidence of a mitochondrial dysfunction in cancer cells. Cancer cells appear to better withstand interference with ATP synthesis in mitochondria since they rely mainly on glycolysis as an energy producing mechanism.
Introduction
Research into the energy metabolism of cancer cells began in the early 20th century with Otto Warburg, whoobserved that tumor tissues appear defective in respiration and have abnormally high rates of aerobic glycolysis [1]. This led Warburg to propose that cancer arouse as a result of mitochondrial injury [2]. Since then several cancer cell metabolism and mitochondrial function has been subject to extensive study. Two of the most well-known and acceptedfeatures of tumor cell metabolism are the “Crabtree effect” [3] and the “Pasteur effect” [4]. The former refers to inhibition of cancer cell respiration by elevated glucose concentrations, while the latter refers to inhibition of glycolysis by elevated oxygen concentration. Presumably, the Crabtree effect arises due to competition between glycolysis and oxidative phosphorylation for Pi and ADP [5]. It has also been observed in some cancer cells that the consumption rate of one nutrient (oxygen or glucose) increases when concentration of the other nutrient is reduced, suggesting an ability of cancer cells to adjust their metabolism based on micro-environment [6]. These observations show that cancer has a very relevant metabolic component.
A variety of abnormalities in cancer cell mitochondrial structure and function have been reported [7-27]. These peculiarities in glucose metabolism may be linked to differences between the mitochondria of cancer cells and those of normal cells [15-27]. These include increases in, and alteration of, mitochondrial DNA [8, 10-14,20-21], elevation ofhexokinase production [15], lysis of cristae structures [23-26] and altered mitochondrial protein and lipid content [24-26]. Interestingly, genetic alterations in cancer cells, such as deregulation of the PI3K/Akt pathway, or imbalances in activity of c-MYC, HIF, or p53, can alter glucose and amino acid metabolism [7,28]. In addition, cancer cells have abnormal content and composition of cardiolipin [29-33], a key mitochondrial lipid that is necessary for proper cell respiration. Cardiolipin normally resides in the inner membrane of mitochondria, where it plays a role in chemiosmosis. In addition, cardiolipin can move to the outer mitochondrial membrane to trigger apoptosis. The “defect” in mitochondrial respiration reported by Warburg may be related to cardiolipin defects in tumor cells [34]. A generalized increase in anabolism characterizes nearly all cancer types [35-36], perhaps indicating consumption of metabolic intermediates toward anabolic reactions, and concomitantly less conversion of pyruvate to oxaloacetate, leaning toward an augmented formation of lactic acid thus indicating an increase dependency on glycolysis as energy mechanism
In the present study, we examine differences between cancer cells and normal cells in three parameters related to mitochondria: ATP production, cardiolipin concentration, and mitochondrial potentials. Moreover, we examine how, in cancer cells and normal cells, these parameters are affected by ATP synthesis inhibitors and, in case of one cancer cell type, chemically induced differentiation. Our results support the idea that mitochondria in cancer cells rely more in glycolysis as their main energy production mechanism.
Methods
Cells
Human cancer cell lines used in this study include HL-60 cells (acute promyelocytic leukemia), K-562 cells (chronic myelogenic leukemia, lymphoblast), MOLT-3 (acute lymphoblastic leukemia, T cells, human), SK-MEL (skin melanoma), PC-3 (prostate carcinoma), HT-1080 (connective tissue, fibrosarcoma), CRL-1977 (uterine sarcoma), and SW-620 (colon adenocarsinoma). Normal human cell lines used in this study include CCD18-lu (lung fibroblasts) and CCL-153 (lung fibroblast). All cell lines were obtained from ATCC (Manassas, VA). In addition, T-lymphocytes were obtained from peripheral blood by incubation in RosetteSep™ antibody cocktail (StemCell Technologies). RosetteSep™ crosslinks unwanted cells to red blood cells, forming immune-rosettes. These immune-rosettes pellet during centrifugation, leaving untouched, highly purified target cells at the interface between the plasma and the density gradient medium.
ATP Measurements
Cellular ATP levels were measured using the CellTiter-GLO Luminescent Cell Viability Assay Kit (Promega, Madison WI). This assay generates a luciferase reaction that is proportional the amount of ATP present within the cells. ATP concentration versus luminescence is linear between zero and 1.5 Million cells (r = 0.90), allowing ATP levels (µmoles) per 106 cells to be determined from luminescence signals using standard curves generated with pure ATP (Sigma, St. Louis MO).
Mitochondrial Potential Measurements
Mitochondrial potential was measured based on fluorescence intensity of JC-1 (Cayman Scientific, Ann Arbor MI), a dye that exhibits potential-dependent accumulation in mitochondria. The dye’s emission shifts from green (535 nm) to red (595 nm) in mitochondria, with the red-to-green ratio indicating mitochondrial potential. To exclude the effect of membrane emission during measurements, membrane potential was dissipated by gentle buffers which do not affect mitochondria (Promega lysis buffer, or by PBS with 0.2% Triton –X, 1mM DTT) before fluorescent spectra were measured. Cells were counted, and 5 x 10⁵ cells were stained using 2.5 µg/mL JC-1. After wash and membrane lysis, emission spectra in range 500 nm to 750 nm were obtained using a SPEX fluorometer (SPEX Industries, Edison NJ). The total accumulation of dye at 595nm is proportional to the mitochondrial potential and the number of mitochondria, while the signal at 535 nm should be independent of this. Thus, we used the ratio of fluorescence at 595 nm to that at 535 nm as our measure of mitochondrial potential.
Cardiolipin Measurements
We used 10-N-nonyl acridine orange (NAO) dye as a cardiolipin probe.NAO monomers have a green fluorescence (flow cytometry channel FL-1) while dimers, formed on contact with cardiolipin, emit a red fluorescence (flow cytometry channel FL-3). NAO specifically binds to cardiolipin with a stoichiometry of 2:1. To measure cardiolipin, 0.5M cells were incubated in medium with NAO (dye concentration in range 1-12 µM). After the 30 min of incubation at 37C, 50µg/ml propidium iodide (PI) was added to stain the DNA of dead cells. Emission of NAO was measured by flow-cytometer.
Cell Differentiation
The HL-60 leukemia model allows us to examine the effects of differentiation on mitochondrial metrics. 12-O-tetradecanoylphorbol-13-acetate (TPA) induces cellular differentiation of a number of leukemia cell lines including HL- 60. TPA was dissolved in DMSO. HL-60 cells were plated in 6-well plates with concentration 106 cells in 5ml growth medium. Cells were then treated with TPA (Sigma, St. Louis MO). Two TPA concentrations were tested, 32 nM and 64 nM. After 24hours, control and TPA treated cells were used in assays described above.
Results
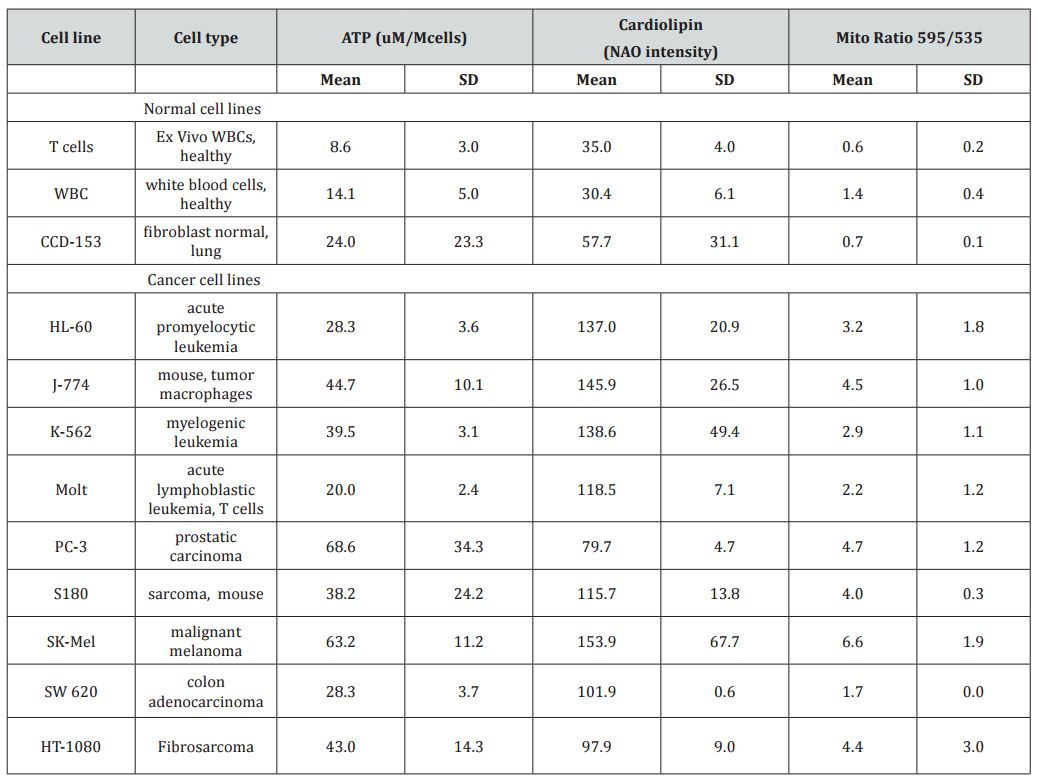
Three key variables were assessed in this study, mitochondrial potential, mitochondrial mass and cellular ATP concentration. Results for several tumor and normal cell types are given in Table 1. There was some variation in values with cell type, but there was a general pattern of the cancer cells having higher ATP levels, greater mitochondrial mass levels (as determined by cardiolipin levels) and higher mitochondrial potentials. This confirms the hypothesis that cancer cell mitochondria have different properties than normal cell mitochondria, consistent with the differences in cancer cell metabolism described in the introduction. Some, but not all, of the variation in mitochondrial potential and ATP production can be explained by differences in mitochondrial mass, as shown in Figure 1(a). According to these data, levels of ATP show a statistically significant correlation with cardiolipin levels in normal cells (r=0.8) and relation with ATP in cancer cells with lower measured ATP for higher levels of cardiolipin. When mitochondrial potential or ATP levels are normalized with mitochondrial mass (dividing by cardiolipin), they are roughly thirty percent higher in cancer cells than in normal cells. This suggests that the larger mitochondrial mass in cancer cells may account in part for their increased ATP production and mitochondrial potentials, although it should be noted that cardiolipin levels may be an imperfect corollary to mitochondrial mass if cardiolipin concentrations vary significantly from one cell type to another. As expected, ATP production rates are highly correlated with mitochondrial potentials (Figure 1b) with higher measured ATP in normal cells in comparison with cancer cells at the same value of mitochondrial potential.
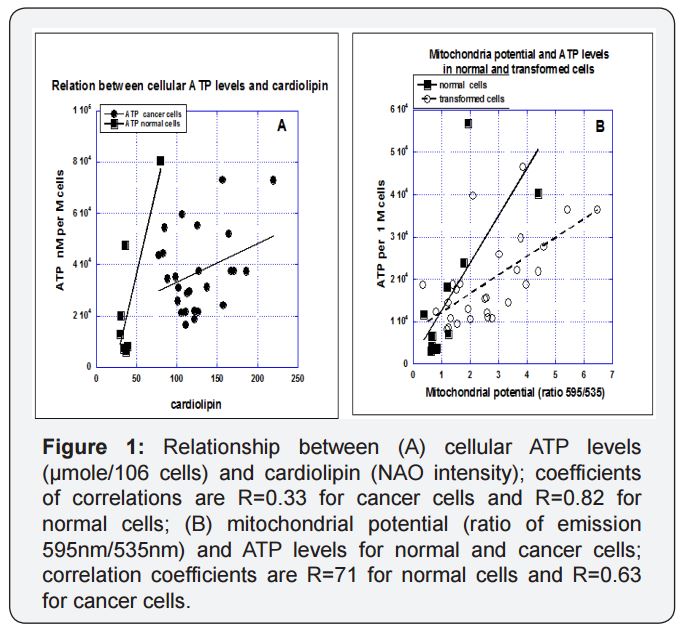
Table 1: Cellular ATP levels (given as µmoles per 106 cells), relative cardiolipin levels (given as flow cytometry peak NonylAcridine Orange emission readings), and relative mitochondrial potentials (given as ratios of JC-1 fluorescence peaks at 595 nm to those at 535 nm) for several normal cells and tumor cell lines.
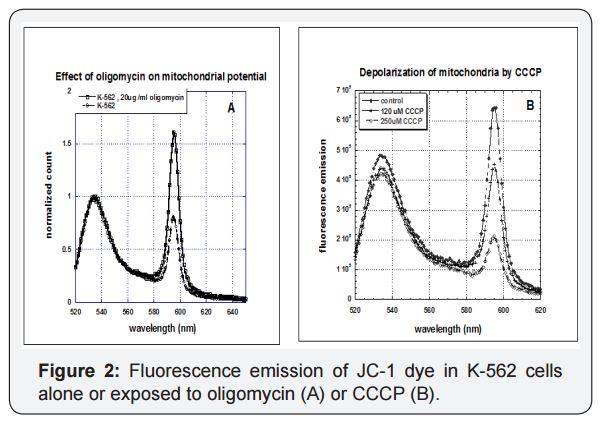
We next examined how tumor cells and normal cells are affected by mitochondrial inhibitors oligomycin and carbonyl cyanide m-chlorophenylhydrazine (CCCP). Fluorescence emission spectra for K-562 leukemia cells loaded with JC-1 dye, as shown in Figure 2, yield two peaks, one at roughly 535 nm and another at 595 nm. Exposure of cells to oligomycin, an ATP-synthase inhibitor that increases mitochondrial potential via buildup of hydrogen ions, increases emission at 595 nm. In contrast, exposure to CCCP, an ionophore that reduces mitochondrial potential, decreasesemission at 595 nm. Note that neither inhibitor prevents the electron transport chain from operating; they simply undo its potential building work (CCCP) or prevent the proton gradients generated from being used to produce ATP (oligomycin). We examined the effects of one or both inhibitors on the mitochondrial parameters described above.
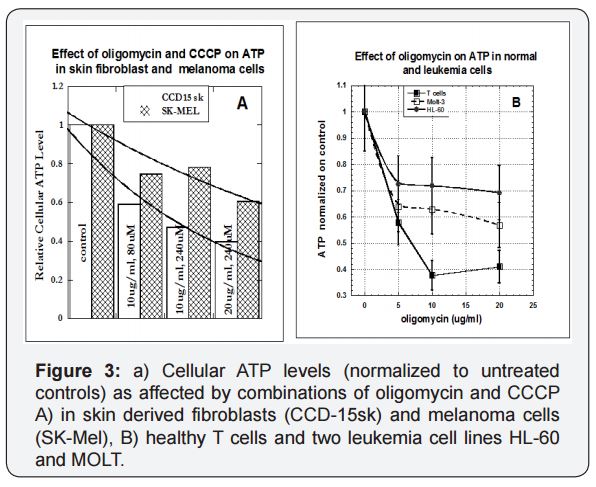
Cellular ATP levels change as a result of inhibitor exposure for the melanoma cell line SK-Mel and the skin-derived fibroblast cell line CCD-15sk in shown in Figure 3a. The inhibitors, as expected, reduced ATP, but with there is a much greater effect on the fibroblasts (normal cells) than on the melanoma (malignant) cells. We were able to confirm this trend for a variety of tumor and normal cell types. The results for T cells and two leukemia cell lines are shown in Figure 3(b).
For T-lymphocytes, ATP levels reduced to 60% of their control levels, while the corresponding ATP level reductions for HL-60, and MOLT tumor cells were 40% of control and 30 % of control. It appears that cancer cells are able to do a better job of maintaining ATP production in the midst of mitochondrial damage since they mainly rely on glycolysis.
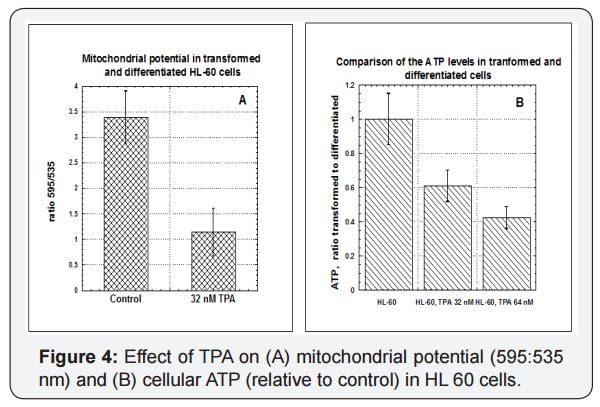
The HL-60 leukemia model allows us to examine the effects of differentiation on mitochondrial metrics. This leukemia cell line normally grows in suspension in vitro. However, in the presence of 8 nM to 64 nM of 12-O-tetradecanoylphorbol 13-acetate (TPA), these cells will attach to plastic substrate, stop dividing, and undergo morphological changes. They also show increased expression of CD11a, consistent with differentiation to a monocyte or macrophage phenotype. Figure 4 shows the effects of TPA induced differentiation on mitochondrial potential (A) and ATP production (B). Undifferentiated HL-60 cells (Control) had significantly higher mitochondria potentials and cellular ATP levels. Again, part of this can be explained by changes in mitochondrial masses, which in transformed HL-60 cells were twice those in TPA differentiated HL-60 cells. We also examined the effects of oligomycin and CCCP on these cells, but the inhibitors were not significant compared to the effects of TPA.
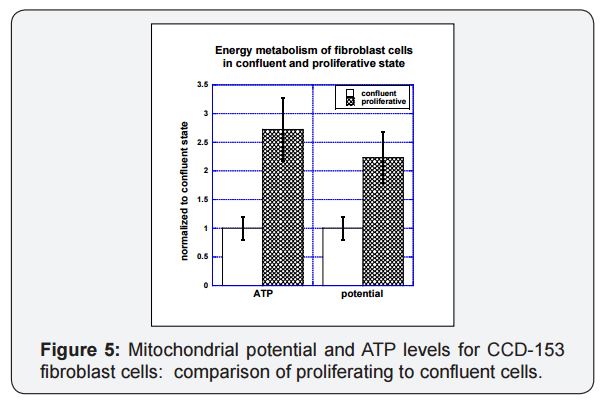
Proliferating cells show higher levels of ATP production and higher mitochondrial potentials relative to non-proliferating cells. This is illustrated in Figure 5, where lung fibroblast cells (CCD-153) grown to confluence (total culture flask surface area coverage) in culture are compared to those given room to proliferate (twenty percent of flask surface area covered). The proliferating cells had mitochondrial potentials twice as high as those for confluent cells and ATP levels in proliferating cells were 2.5 times higher than those in confluent cells. A similar twofold increase with proliferation was observed for mitochondrial mass, as measured by cardiolipin.
To summarize; tumor cells tended to have higher ATP levels per cell, more mitochondrial mass per cell and higher mitochondrial potentials relative to normal cells. Increased numbers of mitochondria is likely a primary factor in the increase of the other two parameters studied. ATP levels and mitochondrial potentials are also increased in proliferating cells, relative to confluent monolayers and in undifferentiated cancer cells, relative to differentiated cells of the same type. The increased mitochondrial mass and activity in cancer cells is also manifest in their ability to more closely maintain normal ATP levels in the face of the ATP synthase inhibitor oligomycin and the ionophore CCCP.A correlation analysis between ATP production and cardiolipin between normal and malignant cells, reveals that there is a high correlation (R=0.8) between ATP in and cardiolipin in the normal cells, while this correlation in malignant cells is relativelypoor (R=0.33)(Figure 1a).
Discussion
For about a century it has been known that one of the most common properties of cancer cells is their ability to utilize and catabolize glucose at high rate. This metabolic alteration of cancer cells called the ‘‘Warburg phenomenon”, that is an increased flow through glycolysis in spite of high oxygen presence, which leads to enhanced lactate generation [37]. Even under conditions of plentiful oxygen, cancer cells still choose to switch to glucose fermentation with subsequent lactic acid formation. It has been explained by various possiblemechanisms such as the metabolic adaptation to the hypoxic environment; by a direct effect of hypoxia-inducible factor on mitochondrial bioenergetics, mutations in oncogenes and proteins related to signal transduction pathways that interfere with mitochondrial bioenergetics and by mutations in mitochondrial DNA or in nuclear genes involved in the metabolic and bioenergetic functions. Nevertheless we favor the metabolic origin of this bioenergetic derangement as explained previously [19].
Today, the Warburg effect is regarded as the phenomenon of increased glycolysis in cancer cells even in the presence of oxygen, without a corresponding increase in oxidative phosphorylation. However, the original hypothesis claiming impaired mitochondrial function to be the cause of the glycolytic phenotype and the formation of cancer has been questioned. We again would like to resurrectthe concept of cancer is a metabolic disease as also explained by Seyfried [22].
Our data are in agreement with other results that show that transformed and proliferative cells achieve high rates of glycolysis [38-40]. Our data also supports an increased glycolysis in transformed cells in comparison with normal cells [41]. In experiments with inhibition of ATP production by OxPhos by addition of CCCP, a pure uncoupler that acts as ionophore, completely dissipating the chemiosmotic gradient, but leaving the electrotransport system uninhibited, resulted in a decrease mitochondrial potential. The addition of CCCP with the antibiotic oligomycin or oligomycin alone, that acts by binding ATP synthase in such a way that blocks the proton channel, the ETC runs but no ATP synthesis occurs, the inhibition of ATP production was 60%-70% in normal cells in comparison 30%- 40% in cancer cells showing that energy production in cancer cells is mainly from glycolysis.
The same results were found for transformed and differentiated leukemia cells HL-60. Cells were differentiated by incubation with different concentrations of TPA. As the result of differentiation the mitochondrial potential and ATP production were decreased 2-3 times. The evaluation of the contribution of glycolysis and OxPhos to the maintenance of ATP content showed the decreased level of ATP (approximately 2 times for the highest concentrations of inhibitors) in differentiated cells in comparison with the transformed cells.
To find if the shift to a glycolytic pathway is increased in cancer cells because glycolysis is required for cellular proliferation, we compared the levels of ATP and mitochondrial potential for normal fibroblast cells (CCD153) at the stages of confluence and proliferation. According to our data there was increase in the mitochondrial potential, mass and energy production in proliferative cells in comparison to confluent cells. It is interesting that the ratio of ATP and mitochondrial potential in confluent cells as compared to proliferative cells was the approximately the same as for cancer and normal cells. We also showed that the growth of tumorigenic and non-tumorigenic cells in typical cell culture media increase cardiolipin, the signature phospholipid of the inner mitochondrial membrane. According to our data the amount of these proteins correlated with mitochondrial potential (R=0.5).
Comparison of the levels of total mitochondrial potential (accumulation of JC-1 dye) and mass in transformed and normal cells showed the increased levels of these parameters in transformed cells that can be, probably, explained by proliferation of the cells. However, our data showed that the ratio of mitochondrial potential to mass was not statistically significant in malignant cells (leukemia cells and transformed fibroblasts) different from normal cells (T cells and fibroblasts CCD-153).
We suggest that increased cardiolipin and the increased level of accumulation of JC-1aggregates in cancer cells can be explained by the increased number of aberrant mitochondria in proliferative cells [42]. Also in Figure 1(b) in which ATP production rates highly correlated with mitochondrial potentials with higher measures of ATP in normal cells in comparison with cancer cells at the same value of mitochondrial potential supports the same principle.
Several studies rule out the possibility that aerobic glycolysis is unique to cancer cells or that the Warburg effect only develops when oxidative capacity is damaged [43]. Indeed, many highly proliferative cancer cell lines that have been carefully studied do not seem to have defects in oxidative metabolism [43-45]. An explanation to these findings is that these studies have not considered mitochondrial substrate level phosphorylation that could give an impression that respiration is active when is not. It could be considered a form of “pseudo-respiration”. This “pseudo-respiration” can also be achieved by Tri-carboxylic acid (TCA) cycle metabolism of Glutamine, which occurs in the mitochondria and not in the cytoplasm giving the false impression of an active oxidative metabolism [17].
According to the review [41], to synthesize lipids, proteins, and nucleic acids, cells use precursors derived from TCA cycle intermediates and a key role of the TCA cycle in proliferating cells is to act as a hub for biosynthesis. Nevertheless these can be provided by glutamine metabolism (substrate level phosphorylation) and not necessarily from oxidative respiration. This is an important difference related to the metabolism of transformed and normal cells. Authors of the review [41] examined the idea that several fluxes, including aerobic glycolysis, de novo lipid biosynthesis, and glutamine-dependent anaplerosis, support proliferation of diverse cell types. The regulation of these fluxes by cellular mediators of signal transduction and gene expression, includes the phosphatidylinositol 3-kinase (PI3K)/Akt/mTOR system, hypoxia-inducible factor 1 (HIF-1), and Myc, during physiologic cell proliferation and tumorigenesis.
In particular, HIF-1 induces expression of pyruvate dehydrogenase kinase 1 (PDK1), which phosphorylates and inhibits the PDH complex [46,47]. This limits entry of glycolytic carbon into the TCA cycle and increases conversion of pyruvate to lactate. This adaptation may be important for cell survival during hypoxia. However, authors suggest that while HIF-1 stimulates glycolysis, and actively represses mitochondrial function and oxygen consumption, HIF-dependent mitochondrial changes are mainly functional.
The other suggestion is that the mechanisms that integrate signal transduction and cell metabolism are largely conserved between normal cells and cancer cells. The major difference is that in normal cells, initiation of signaling requires extracellular stimulation, while cancer cells often have damaged mitochondria and mutations that chronically enhance these pathways, allowing them to maintain a metabolic phenotype of biosynthesis independently of normal physiologic constraints.
According to several studies, mitochondria from tumor cells present evident ultra-structural alterations, are deficient in the b-F1 ATP synthase subunit, and are characterized by an increased Δ Ψ [48,49], altogether pointing to primary defects in the respiratory chain that may contribute to aerobic glycolysis. Mitochondrial potential required for mitochondrial ATP synthesis via F1FO-ATP synthase and many types of cancers exhibit increased mitochondrial potential, often coupled to inefficient OXPHOS [50,51].
Other studies have confirmed that restricting glycolysis or diverting pyruvate into the mitochondria, can significantly induce respiration in cancer cells [7,19,52]. These studies confirmed that the fate of pyruvate [either reduction in the cytosol by lactate dehydrogenase (LDH) or oxidation in the mitochondria by pyruvate dehydrogenase (PDH)] can determine the direction of tumor metabolism. The inhibition of lactate dehydrogenase or the activationof pyruvate dehydrogenase [via the inhibition of pyruvate dehydrogenase kinase (PDK)], can induce tumor cells to oxidize pyruvate in the TCA cycle and stimulate mitochondrial respiration [7,19,53]. It suggests that mitochondrial activity is not irrevocably impaired in cancer cells as thought by Warburg.
In the study [9] data shows that the defective mitochondrial system described in cancer cells can be dramatically improved by solely changing substrate availability and that HeLa cells can adapt their mitochondrial network structurally and functionally to derive energy by glutaminolysis only. This could also provide an explanation for the enhancement of oxidative phosphorylation capacity observed after tumor regression or removal. This work demonstrates that the pleomorphic, highly dynamic structure of the mitochondrion can be remodeled to accommodate a change in oxidative phosphorylation activity.
Conclusion
The cancer cell lines we examined tend to have higher mitochondrial potentials, cardiolipin levels, and ATP levels (on a per-cell basis) than the normal cell lines, with increased mitochondrial mass (as indicated by increased cardiolipin levels) being a major factor in elevating levels of the other two variables in cancer cells. This suggests that cancer cells seem to make up for the apparent insufficiency of aerobic respiration (in terms of ATP production) by increasing the glycolytic rate and, probably, by utilizing glutamine fermentation as an energy source.
Reference
1. Warburg O (1956) On respiratory impairment in cancer cells. Science 124(3215): 269-270.
2. Warburg O (1956) On the origin of cancer cells. Science 123(3191): 309-314.
3. Crabtree HG (1929) Observations on the carbohydrate metabolism of tumours. Biochem J 23(3): 536-545.
4. Krebs H (1972) The Pasteur effect and the relations between respiration and fermentation. Essays in Biochemistry 8: 1-34.
5. Yeung SJ, Pan J, Lee MH (2008) Roles of p53, Myc and HIF-1 in regulating glycolysis—the seventh Hallmark of cancer. Cell Mol Life Sci 65(24): 3981-3999.
6. Casciari JJ, Sotirchos SV, Sutherland RM (1992) Variations in tumor cell growth rates and metabolism with oxygen concentration, glucose concentration, and extracellular pH. J Cell Physiol 151(2): 386-394.
7. Rossignol R, Gilkerson R, Aggeler R, Yamagata K, Remington SJ, et al. (2004) Energy substrate modulates mitochondrial structure and oxidative capacity in cancer cells. Cancer Res 64(3): 985-993.
8. Brandon M, Baldi P, Wallace DC (2006) Mitochondrial mutations in cancer. Oncogene 25(34): 4647-4662.
9. Czarnecka AM, Czarnecki JS, Kukwa W, Cappello F, Scińska A, et al. (2010) Molecular oncology focus – is carcinogenesis a ‘mitochondriopathy’? J Biomed Sci 17: 31.
10. Modica-Napolitano JS, Kulawiec M, Singh KK (2007) Mitochondria and human cancer. Curr Mol Med 7(1): 121-131.
11. Ellinger J, Albers P, Muller SC, von Ruecker A, Bastian PJ (2009) Circulating mitochondrial DNA in the serum of patients with testicular germ cell cancer as a novel non-invasive diagnostic biomarker. BJU Int 104(1): 48-52.
12. Kohler C, Radpour R, Barekati Z, Asadollahi R, Bitzer J, et al. (2009) Levels of plasma circulating cell free nuclear and mitochondrial DNA as potential biomarkers for breast tumors. Mol Cancer 8: 105.
13. Zachariah R R, Schmid S, Buerki N, Radpour R, Holzgreve W, et al. (2008) Levels of circulating cell-free nuclear and mitochondrial DNA in benign and malignant ovarian tumors. Obstet Gynecol 112(4): 843- 850.
14. Shapovalov Y, Hoffman D, Zuch D, de Mesy Bentley KL, Eliseev RA (2011) Mitochondrial Dysfunction in Cancer Cells Due to Aberrant Mitochondrial Replication. Biol Chem 286(25): 22331-22338.
15. Mathupala SP, Rempel A, Pedersen PL (1997) Aberrant glycolytic metabolism of cancer cells. J Bioenergetics and Biomembranes 29(4): 339-343.
16. Israel BA, Schaeffer WI (1988) Cytoplasmic mediation of malignancy. In Vitro Cell Dev Biol 24(5): 487-490.
17. Seyfried TN (2012) Respiratory dysfunction in cancer cells. In Cancer as a Metabolic Disease: On the Origin, Management, and Prevention of Cancer. John Wiley & Sons, Hoboken, NJ, pp. 73–105.
18. Arismendi-Morillo G (2011) Electron microscopy morphology of the mitochondrial network in gliomas and their vascular microenvironment. BiochimBiophysActa 1807: 602-608.
19. Gonzalez MJ, Miranda Massari JR, Duconge J, Riordan NH, Ichim T, et al. (2012) The bio-energetictheory of carcinogenesis. Med Hypotheses 79(4): 433-439.
20. Petros JA, Baumann AK, Ruiz-Pesini E, Amin MB, Sun CQ, et al. (2005) mtDNA mutations increase tumorigenicity in prostate cancer. Proc Natl AcadSci U. S. A. 102(3): 719-724.
21. Darlington CD (1948) The plasmagene theory of the origin of cancer. Br J Cancer 2(2): 118-126.
22. Seyfried TN, Helton LM (2010) Cancer as a metabolic disease. Nutr Metab 7:7.
23. Arismendi-Morillo G (2009) Electron microscopy morphology of the mitochondrial network in human cancer. Int J Biochem Cell Biol 41(10): 2062-2068.
24. Arismendi-Morillo GJ, Castellao-Ramirez AV (2008) Ultrastructural mitochondrial pathology in human astrocytic tumors: potentials implications pro-therapeutics strategies. J Electron Microsc (Tokyo) 57(1): 33-39.
25. Galluzzi L, Morselli E, Kepp O, Vitale I, Rigoni A, et al. (2010) Mitochondrial gateways to cancer. Mol Aspects Med 31(1): 1-20.
26. Pedersen PL (1978) Tumor mitochondria and the bioenergetics of cancer cells. Prog Exp Tumor Res 22: 190-274.
27. Kiebish MA, Han X, Cheng H, Chuang JH, Seyfried TN (2008) Cardiolipin and electron transport chain abnormalities in mouse brain tumor mitochondria: lipidomic evidence supporting the Warburg theory of cancer. J Lipid Res 49(12): 2545-2556.
28. Semenza GL, Artemov D, Bedi A, Bhujwalla Z, Chiles K, et al. (2001) The metabolism of tumours: 70 years later. Novartis Found Symp 240: 251-260.
29. Jahnke VE, Sabino O, DefourA, Castells J, Lefai E, et al. (2010) Evidence for mitochondrial respiratory deficiency in rat rhabdomyosarcoma cells. PLoS One 5: e8637.
30. Schild L, Lendeckel U, Gardemann A, Wiswedel I, Schmidt CA, et al. (2012) Composition of molecular cardiolipin species correlates with proliferation of lymphocytes. Exp Biol Med (Maywood) 237(4): 372- 379.
31. Kocherginsky N (2009) Acidic lipids, H(+)-ATPases, and mechanism of oxidative phosphorylation. Physico-chemical ideas 30 years after P. Mitchell’s Nobel Prize award. Prog Biophys Mol Biol 99(1): 20-41.
32. Claypool S, Koehler CM (2012) The complexity of cardiolipin in health and disease. Trends BiochemSci 37(1): 32-41.
33. Vogelstein B, Lane D, Levine AJ (2000) Surfing the p53 network. Nature 408(6810): 307-310.
34. Kiebish MA, Han X, Cheng H, Chuang JH, Seyfried TN (2008) Cardiolipin and electron transport chain abnormalities in mouse brain tumor mitochondria: lipidomic evidence supporting the Warburg theory of cancer. J Lipid Res 49(12): 2545-2556.
35. Galluzzi L, Morselli E, Kepp O, Vitale I, Rigoni A, et al. (2010) Mitochondrial gateways to cancer. Molecular Aspects of Medicine 31(1): 1-20.
36. Lopez-Rios F, Sanchez-Arago M, Garcia-Garcia E, Ortega AD, Berrendero JR, et al. (2007) Loss of the mitochondrial bioenergetic capacity underlies the glucose avidity of carcinomas. Cancer Res 67(19): 9013- 9017.
37. Papandreou I, Cairns RA, Fontana L, Lim AL, Denko NC (2006) HIF-1 mediates adaptation to hypoxia by actively downregulating mitochondrial oxygen consumption. Cell Metab 3(3): 187-197.
38. Leni Z, Parakkal G, Arcaro A (2013) Emerging metabolic targets in the therapy in the therapy of hematological malignancy. Biomed Res Int 2013: 946206.
39. Onodera Y, Nam JM, Bissell MK (2014) Increased sugar uptake promotes oncogenesis via EPAC/RAP1 and O-GlcNAc pathways. J Clin Invest 124(1): 367-384.
40. Hammoudi N, Ahmed KB, Garcia-Prieto C, Juang P (2011) Metabolic alteration in cancer cells and therapeutic implications. Chin J Cancer 30(8): 508-525.
41. DeBerardinis RJ, Lum JJ, Hatzivassiliou G, and Thompson CB (2008) The Biology of Cancer: Metabolic reprogramming Fuels Cell Growth and Proliferation. Cell Metab 7(1): 11-20.
42. Hoek JB, Nicholls DG, Williamson JR (1980) Determination of the mitochondrial proton motive force in isolated hepatocytes. J BiolChem 255(4): 1458-1464.
43. Moreno-Sanchez R, Rodriguez-Enriquez S, Marin-Hernandez A, Saavedra E (2007) Energy metabolism in tumor cells. FEBS J 274(6) 1393-1418.
44. Wang T, Marquardt C, Foker J (1976) Aerobic glycolysis during lymphocyte proliferation. Nature 261: 702-705.
45. Wallace DC (2005) Mitochondria in cancer: Warburg addressed. Cold Spring HarbSymp Quant Biol 70: 363-374.
46. Kim JW, Tchernyshyov I, Semenza GL, Dang CV (2006) HIF-1- mediated expression of pyruvate dehydrogenase kinase: a metabolic switch required for cellular adaptation to hypoxia. Cell Metab 3(3): 177-185.
47. Papandreou I, Cairns RA, Fontana L, Lim AL, Denko NC (2006) HIF-1 mediates adaptation to hypoxia by actively downregulating mitochondrial oxygen consumption. Cell Metab 3(3): 187-197.
48. España L, Martín B, Aragüés R, Chiva C, Oliva B, et al. (2005) Bcl-x(L)- mediated changes in metabolic pathways of breast cancer cells: from survival in the blood stream to organ-specific metastasis. Am J Pathol 167(4): 1125-1137.
49. Frezza C, Gottlieb E (2009) Mitochondria in cancer: Not just innocent bystanders. Sem Cancer Biol 19(1): 4-11.
50. Chang HJ, Lee MR, Hong SH, Yoo BC, Shin YK, et al. (2007) Identification of mitochondrial FoF1-ATP synthase involved in liver metastasis of colorectal cancer. Cancer Sci 98(8): 1184-1191.
51. Cuezva JM, Krajewska M, de Heredia ML, Krajewski S, Santamaria G, et al. (2002) The bioenergetic signature of cancer: a marker of tumor progression. Cancer Res 62(22): 6674-6681.
52. Bonnet S, Archer SL, Allalunis-Turner J, Haromy A, Beaulieu C, et al. (2007) A mitochondria-K+ channel axis is suppressed in cancer and its normalization promotes apoptosis and inhibits cancer growth. Cancer Cell 11(1): 37-51.
53. Takahashi E, Sato M (2014) Anaerobic respiration sustains mitochondrial membrane potential in a prolyl hydroxylase pathwayactivated cancer cell line in a hyp